-
 Call Us :
 -
Mail Us :
-
Request a Call


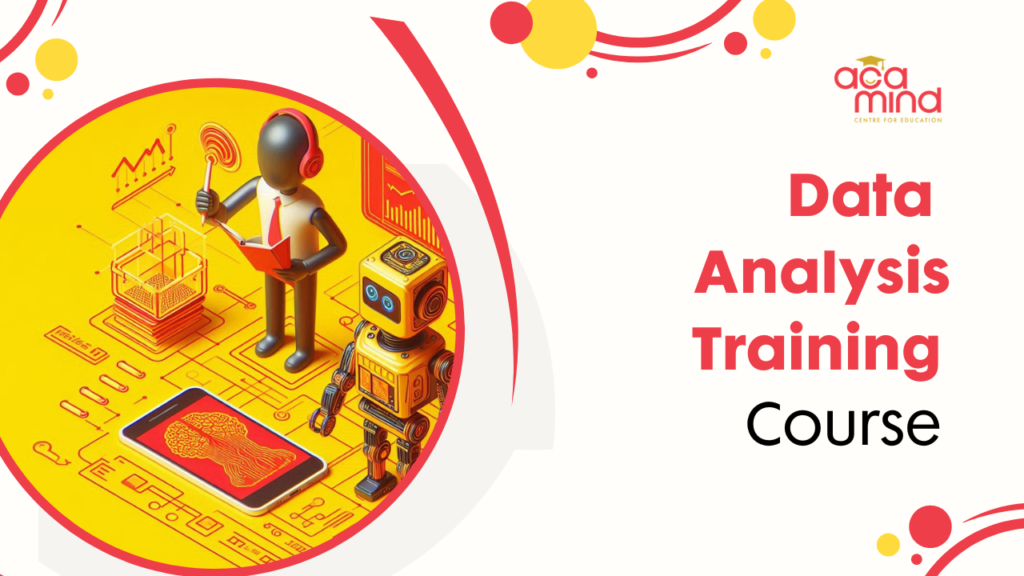
Harness the full potential of data to make smarter, more strategic business decisions in our immersive Data Analysis Training Course. Over eight days, you’ll build essential skills in data analysis, visualization, and presentation, using powerful tools like Excel, Power BI, and Tableau. This hands-on course focuses on real-world techniques you can immediately apply, from transforming raw data into insightful visuals to creating dashboards that support and drive business strategies. Designed for those with an intermediate to advanced understanding of data, this course provides the know-how to confidently approach any data project and turn information into meaningful actions.
Upon completing the course, you’ll gain valuable credentials that showcase your expertise in data analytics. You’ll receive both an Acamind Academy Certification and a KHDA Certification, highlighting your commitment to data excellence and enhancing your professional profile. Join us and take the next step toward becoming a skilled data-driven decision-maker, ready to create impactful results with every analysis.
Whether you’re a seasoned marketer or a passionate beginner, this program will elevate your digital marketing prowess and give you a competitive edge in the industry.







Conducted more than 10K+ training hours for more than 10K+ participants about latest technologies.
A highly skilled and creative professional instructor specializing in cutting-edge technologies. With a wealth of expertise in and passion for sharing knowledge, also dynamic personality and engaging teaching style, Mohammed Marwan is a sought-after instructor who is dedicated to helping others unlock their full potential and achieve their goals.
Pandas, ThingWorx, DataRobot, Matplotlib, Karas, Hard, UiPath, Learn, NumPy, Power BI
Note:
Professionals aiming to sharpen their skills in data interpretation and actionable insights.
Experts seeking to streamline financial analysis and reporting using advanced tools.
Individuals focused on leveraging data for improved strategies and operational efficiency.
Tech-savvy professionals keen on mastering data visualization and business intelligence techniques.
Learners eager to build a strong foundation in data handling and create impactful visualizations.
Whether you’re enhancing existing skills or aiming to become proficient in data visualization, this course provides valuable, career-ready training.
Lead the Future: Mastering Leadership with AI
Master Data Analysis for Business
Understand data’s impact on decision-making.
Excel Expertise
Learn advanced Excel for data manipulation, cleaning, and summarization.
Dynamic Data Visualization
Create compelling charts, dashboards, and visualizations in Excel.
Power BI Proficiency
Import, transform, and model data while mastering DAX basics and advanced visualizations.
Tableau Foundations
Build interactive dashboards and publish them to the cloud.
Premier Education Hub
Trusted by professionals across industries
Expert Instructors







Note:

ML
Educator
Digital Marketing/Education consultant
Note:
Session 1: Overview of Data Analysis – Role, importance, and impact on business decisions.
Session 2: Excel Basics for Data Analysis – Formulas, functions, and data entry techniques.
Session 3: Intermediate Excel Features – Sorting, filtering, and basic data functions.
Session 1: Advanced Excel Functions – Using complex formulas for data analysis.
Session 2: Data Cleaning Techniques – Handling missing data, errors, and duplicates.
Session 3: PivotTables and PivotCharts – Summarizing data to find patterns and insights.
Session 1: Introduction to Excel Charts – Customizing charts and graphical representations.
Session 2: Conditional Formatting and Advanced Visualization – Enhancing data presentation.
Session 3: Dashboard Basics in Excel – Building dashboards using Excel tools.
Session 1: Getting Started with Power BI – Setup, interface, and basic functionalities.
Session 2: Data Import and Transformation in Power BI – Using Power Query.
Session 1: Data Modeling – Creating and managing relationships, calculated columns.
Session 2: DAX Basics – Introduction to Data Analysis Expressions.
Session 1: Advanced Visualizations – Using slicers, timelines, and custom visuals.
Session 2: Power BI Service – Publishing the report to the cloud and sharing it with the clients
Session 1: Setting Up Tableau – Basics of the interface and connecting to data sources.
Session 2: X Creating a Relationship between different tables
Session 1: Exploring Tableau Features – Filters, groups, and sets.
Session 2: Creating Visualizations using different charts – Building interactive dashboards.
Session 3: Publishing the report to the tableau cloud
Note:
Note:
Upon course completion, you will receive:
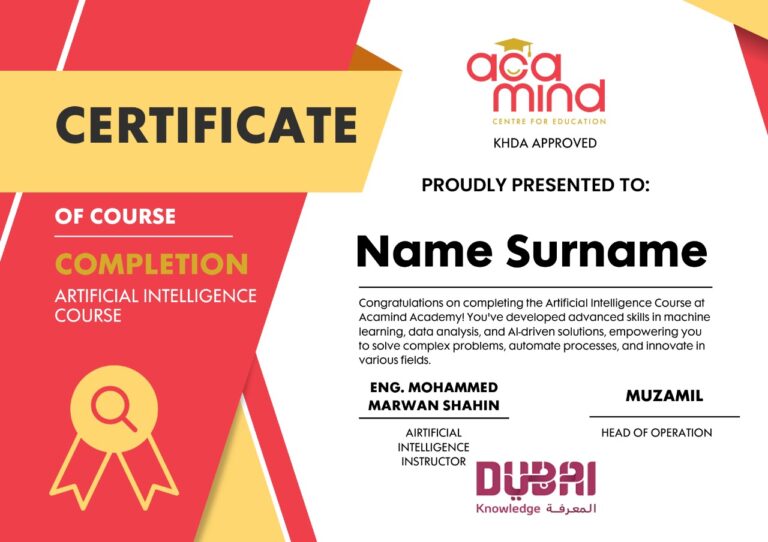
Upon course completion, you will receive:

Note:
Our talented and dedicated teachers are here to support and encourage you throughout your learning journey. We believe it is our responsibility to inspire enthusiasm for learning and to help our students succeed in their pursuits. Situated in the vibrant heart of Dubai’s Al Karama, just steps from ADCB Metro Station, Acamind Academy stands as a premier destination for exceptional educational support and professional development. Join us at Acamind and take the first step toward your dreams. Let’s achieve success together!
Below EMI plans are available for the Programme Fee: INR 1,90,000 + GST
| Maximum Loan Amount | Tenure (Months) | EMI |
| INR 2,24,200 | 12 | 20458 |
| INR 2,24,200 | 18 | 14230 |
| INR 2,24,200 | 24 | 11117 |
| INR 2,24,200 | 36 | 8003 |
| INR 2,24,200 | 48 | 6446 |
Notes:
The above EMIs are indicative. The EMIs offered might vary from the above figures, depending upon tenure and loan amount to be disbursed.
Other EMI tenures available (Months):
Propelld: 12/18/24/30/36
Acamind Academy Data Analysis Training Course teaches you data analysis, visualization and presentation skills needed to make smarter business decisions. It’s about practical, real-world techniques for everything from turning raw data into insightful visuals to building dashboards that can drive business strategies.
You will get hands-on experience with Excel, Power BI, and Tableau. This training includes data cleaning, PivotTables, Power Query, DAX basics, interactive dashboards and publishing reports to the cloud to develop practical data manipulation and visualization skills.
The course suits business and data analysts, financial analysts, accountants, marketing, sales and operations professionals, and IT or BI professionals. Anyone wanting stronger data analysis and visualization skills can also attend to build career-ready capabilities.
The course is designed for learners with an intermediate to advanced understanding of data, so some data experience helps. No prior coding knowledge is required so that you can focus on practical analysis and visualization skills without programming.
You will learn formulas, advanced functions, sorting, filtering, data cleaning for missing values, errors, and duplicates, plus PivotTables and PivotCharts. You will also build charts, conditional formatting, and basic dashboards in Excel to summarize data and spot patterns.
In Power BI, you import and transform data with Power Query, model relationships, learn DAX basics, use slicers, and publish reports to the cloud. In Tableau, you connect data, apply filters, build interactive dashboards, and publish them to Tableau Cloud.
The Data Analysis Training Course totals 35 hours across eight days, with a weekly commitment of 4–6 hours. Sessions are hands-on and follow a structured sequence, moving from foundational concepts to published dashboards, helping you build skills steadily.
The course is offered in both online and offline modes and is integrated with Generative AI. Acamind Academy is located in Dubai’s Al Karama, just steps from ADCB Metro Station, making in-person attendance more convenient.
On completion, you receive an Acamind Academy Certification and a KHDA Certification. The KHDA certificate is chargeable at AED 150, while the other certifications are completely free of cost. Both credentials highlight your data analytics expertise.
You gain industry-relevant data visualization and analysis skills applicable to business analysis, finance, marketing, and IT roles. Learning to build dashboards and present findings helps you support more confident, data-driven business decisions.

 Our Support
 Call Us :
 Mail Us :
 Request a Call